
What 3,062 Instagram posts from 1,827 creator and customer accounts reveal about engagement, views and scale
UAE Restaurant Influencer Marketing Benchmarks 2026
| Posts analyzed | Creator/accounts | Data start | Data end |
|---|---|---|---|
| 3,062 | 1,827 | 6 Feb 2015 | 1 Oct 2026 |
Download the Full UAE Restaurant Influencer Benchmark Study
Get the complete analysis of 3,062 Instagram posts, including creator-tier benchmarks, Reel views, engagement rates and practical selection guidance.
Choosing a restaurant influencer by follower count alone can lead to the wrong conclusion. Impacto analyzed 3,062 Instagram posts from 1,827 creators that collaborated with restaurants in our UAE dataset. The results show a clear trade-off between engagement efficiency and absolute scale. Smaller accounts generated much higher engagement relative to audience size, while larger creators generally produced far more interactions and views in absolute terms. There was no single creator tier that performed best on every measure.
That distinction matters because a restaurant looking for efficient engagement should not necessarily choose the same creator as a restaurant trying to maximize views, interactions, or audience conversation. The dataset spans February 2015 through October 1, 2026. Because the collection method favors more recent posts, the historical distribution should not be interpreted as a trend in the growth of influencer marketing.
The market context is meaningful: SevenRooms’ 2025 UAE Restaurant Industry Trends research reports that 74% of UAE diners use social media to discover new restaurants, and one in four discover restaurants through influencers. That does not benchmark creator performance, but it shows why the question matters for restaurant marketers in the UAE.
Key findings
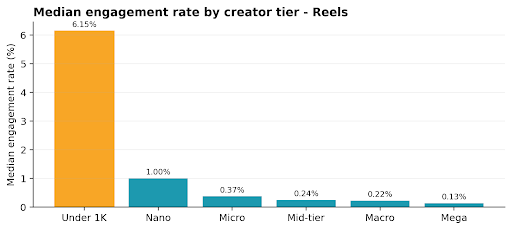
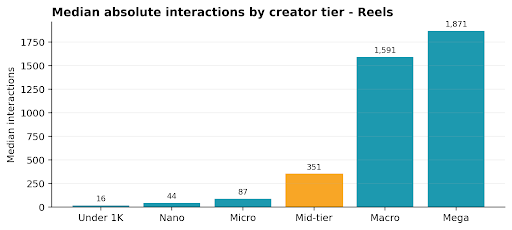
- Engagement rate is not the same as total performance. Under-1K Reels had a 6.15% median engagement rate but only 16 median interactions. Mid-tier Reels had a 0.24% median engagement rate but 351 median interactions.
- Small accounts were more efficient relative to audience size. 38.9% of under-1K Reels generated reported views equal to or above the account’s follower count, compared with 8.6% for nano creators and 3.3% for micro creators.
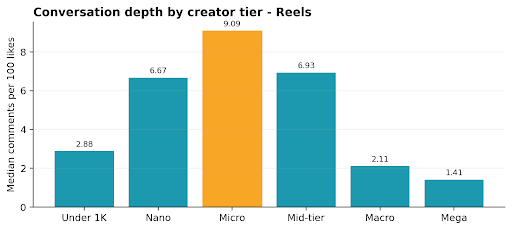
- Micro creators stood out on conversation depth. Micro Reels generated a median 9.09 comments per 100 likes, the highest figure among the creator tiers in this dataset.
- Reels did not universally outperform photos. The result changed by creator tier and by whether success was measured through engagement rate or absolute interactions.
- Medians are more useful than averages for a typical benchmark. For mega Reels, average views were 189,098 while the median was only 13,236, showing how heavily a few breakout posts can pull the mean upward.
Restaurant Influencer Benchmarks by Creator Size
For the headline benchmarks, Impacto uses medians rather than averages because the performance distributions are highly skewed. The median is intended to describe a more typical result, while percentile ranges show how widely outcomes vary.
Reels and video
| Creator tier | Posts | Median ER | Median interactions | Median views | Median views / follower |
|---|---|---|---|---|---|
| Under 1K | 343 | 6.15% | 16 | 148 | 0.61x |
| Nano 1K-10K | 528 | 1.00% | 44 | 476 | 0.14x |
| Micro 10K-50K | 331 | 0.37% | 87 | 880 | 0.04x |
| Mid-tier 50K-500K | 425 | 0.24% | 351 | 6,857 | 0.05x |
| Macro 500K-1M | 52 | 0.22% | 1,591 | 36,595 | 0.05x |
| Mega 1M+ | 63 | 0.13% | 1,871 | 13,236 | 0.01x |
Interpret the macro and mega rows more cautiously. Their samples contain fewer creators than the nano, micro and mid-tier groups, so a small number of accounts can influence the result more heavily.
Photos and carousels
| Creator tier | Posts | Median ER | Median interactions | Median likes | Median comments |
|---|---|---|---|---|---|
| Under 1K | 355 | 4.76% | 13 | 13 | 0 |
| Nano 1K-10K | 477 | 1.29% | 35 | 34 | 1 |
| Micro 10K-50K | 214 | 0.51% | 100 | 94 | 5 |
| Mid-tier 50K-500K | 192 | 0.13% | 249 | 221 | 5 |
| Macro 500K-1M | 13 | 0.25% | 1,524 | 1,483 | 41 |
| Mega 1M+ | 69 | 0.02% | 389 | 378 | 12 |
The macro photo result is based on only 13 posts and should not be treated as a stable standalone benchmark.
Smaller Creators Win on Efficiency. Larger Creators Win on Scale
Does a Higher Engagement Rate Mean Better Influencer Performance?
No. Engagement rate measures performance relative to audience size. It does not tell you how many total views, likes, comments or interactions a post produced.
Under-1K Reels recorded a median engagement rate of 6.15%. The median post generated 14 likes, 1 comment, 16 total interactions and 148 views. Mid-tier Reels, by contrast, recorded a median engagement rate of only 0.24%, but the median post generated 293 likes, 25 comments, 351 interactions and 6,857 views.
That means the under-1K group delivered about 25.6 times the median engagement rate of the mid-tier group, while the mid-tier group delivered about 21.9 times the median number of absolute interactions. Both statements are true. They simply answer different questions.
Efficiency -> Scale -> Conversation
Impacto performance framework
Efficiency asks how much performance a creator generates relative to audience size. Scale asks how much attention or interaction the post generates in absolute terms. Conversation looks at how strongly the audience responds beyond a simple like. Restaurants should evaluate all three instead of treating follower count or engagement rate as a single score of creator quality.
Small Accounts Are More Likely to Reach Beyond Their Existing Audience
How Often Do Restaurant Reels Get More Views Than a Creator Has Followers?
Follower-normalized Reel performance produced one of the clearest patterns in the dataset. Among Reels from accounts with fewer than 1,000 followers, 38.9% generated reported views equal to or greater than the account’s follower count. 22.3% reached at least 2x the follower count, and 10.4% reached at least 5x.
| Creator tier | Reels above 1x followers | Above 2x | Above 5x |
|---|---|---|---|
| Under 1K | 38.9% | 22.3% | 10.4% |
| Nano 1K-10K | 8.6% | 3.8% | 1.5% |
| Micro 10K-50K | 3.3% | 1.2% | 0.3% |
| Mid-tier 50K-500K | 1.7% | 1.2% | 0.2% |
| Macro 500K-1M | 1.9% | 1.9% | 0.0% |
| Mega 1M+ | 0.0% | 0.0% | 0.0% |
This does not mean smaller accounts generate more total views. They do not. It means their reported Reel view counts were more likely to be large relative to the size of the account’s existing follower base. Reported views should also not be interpreted as unique reach.
Micro Creators Generate the Deepest Comment Activity
Which Influencer Size Generates the Most Conversation?
Engagement rate combines likes and comments into one interaction total, but those actions are not identical. To look at audience response from another angle, Impacto measured comments per 100 likes and excluded obvious giveaway or contest language from that calculation.
| Creator tier | Median comments per 100 likes – Reels |
|---|---|
| Under 1K | 2.88 |
| Nano 1K-10K | 6.67 |
| Micro 10K-50K | 9.09 |
| Mid-tier 50K-500K | 6.93 |
| Macro 500K-1M | 2.11 |
| Mega 1M+ | 1.41 |
Micro creators recorded the highest median comment activity relative to likes in this dataset. That makes them worth closer consideration when a restaurant values audience discussion, but it should not be interpreted as proof of higher purchase intent, bookings, footfall or revenue. Those outcomes were not measured.
Do Reels Perform Better Than Photos for Restaurants?
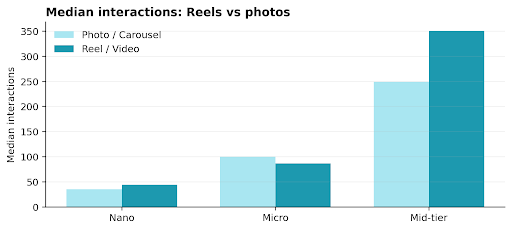
Not consistently. The answer changes by creator size and by the metric used.
| Tier | Photo median ER | Reel median ER | Photo median interactions | Reel median interactions |
|---|---|---|---|---|
| Nano | 1.29% | 1.00% | 35 | 44 |
| Micro | 0.51% | 0.37% | 100 | 87 |
| Mid-tier | 0.13% | 0.24% | 249 | 351 |
Nano
For nano creators, photos had a higher median engagement rate (1.29% vs 1.00%), while Reels generated more median interactions (44 vs 35).
Micro
For micro creators, photos led on both median engagement rate (0.51% vs 0.37%) and median interactions (100 vs 87).
Mid-tier
For mid-tier creators, Reels led on both median engagement rate (0.24% vs 0.13%) and median interactions (351 vs 249).
For nano creators, photos had the higher median engagement rate, while Reels generated more median interactions. For micro creators, photos led on both measures. For mid-tier creators, Reels led on both engagement rate and median interactions. The useful conclusion is therefore not that restaurants should always prefer Reels. Format performance depends on creator tier and on what the restaurant considers a successful outcome.
Why We Use Median Performance Instead of Average Performance
Average social media performance can look dramatically different from typical performance when a small number of posts go viral. In this dataset, under-1K Reels averaged 1,279 views but had a median of only 148. Mega Reels averaged 189,098 views but had a median of 13,236. Mega Reel interactions showed the same pattern: an average of 13,176.8 compared with a median of 1,871.
This is a standard issue in skewed data. The NIST Engineering Statistics Handbook explains that mean and median can diverge materially in skewed distributions because the mean is pulled toward the long tail. For that reason, this benchmark uses the median as the primary description of a typical result, while P25, P75 and P90 are useful for understanding the wider distribution. Average figures remain useful as supplementary context, but they should not be mistaken for what a typical post is likely to produce.
What Creator Size Should a Restaurant Choose?
The data does not support one universal tier for every restaurant. A better approach is to start with the campaign objective, then evaluate creator fit and cost alongside performance.
| Campaign objective | What the data suggests considering |
|---|---|
| Strong engagement relative to audience size | Smaller accounts and nano creators |
| More absolute interactions | Mid-tier and larger creators |
| More absolute Reel views | Larger creator tiers |
| Strong comment activity relative to likes | Micro creators performed particularly well |
| Greater chance of views exceeding follower count | Under-1K accounts performed particularly well |
| Balanced campaign | Mix creator sizes rather than using follower count alone |
This is not a prescription to automatically hire the tier named in each row. Creator selection should still consider audience geography, restaurant and cuisine relevance, content quality, audience quality, past performance, cost, and the actual campaign objective. Follower count should be treated as one input, not the decision rule.
The Full UAE Restaurant Influencer Benchmark Table
For readers who want the full distribution rather than headline medians, the tables below show P25, median, P75 and P90 for the core performance metrics. P25 and P75 describe the middle half of observed performance, while P90 provides a reference point for stronger outcomes.
Engagement Rate Distribution
| Creator tier | Format | Posts | P25 | Median | P75 | P90 |
|---|---|---|---|---|---|---|
| Under 1K | Photo / Carousel | 355 | 2.01% | 4.76% | 9.95% | 21.45% |
| Under 1K | Reel / Video | 343 | 2.34% | 6.15% | 16% | 41.98% |
| Nano 1K-10K | Photo / Carousel | 477 | 0.39% | 1.29% | 2.98% | 5.43% |
| Nano 1K-10K | Reel / Video | 528 | 0.47% | 1% | 2.3% | 5.54% |
| Micro 10K-50K | Photo / Carousel | 214 | 0.16% | 0.51% | 1.31% | 3.71% |
| Micro 10K-50K | Reel / Video | 331 | 0.16% | 0.37% | 0.96% | 2.15% |
| Mid-tier 50K-500K | Photo / Carousel | 192 | 0.04% | 0.13% | 0.48% | 0.89% |
| Mid-tier 50K-500K | Reel / Video | 425 | 0.1% | 0.24% | 0.55% | 1.27% |
| Macro 500K-1M | Photo / Carousel | 13 | 0.07% | 0.25% | 0.41% | 1.34% |
| Macro 500K-1M | Reel / Video | 52 | 0.1% | 0.22% | 0.58% | 1.56% |
| Mega 1M+ | Photo / Carousel | 69 | 0.01% | 0.02% | 0.05% | 0.24% |
| Mega 1M+ | Reel / Video | 63 | 0.01% | 0.13% | 0.68% | 1.36% |
Engagement rate is calculated as (likes + comments) / followers x 100. Because follower counts were measured at collection time, older follower-normalized results should be treated directionally.
Total Interactions Distribution
| Creator tier | Format | Posts | P25 | Median | P75 | P90 |
|---|---|---|---|---|---|---|
| Under 1K | Photo / Carousel | 355 | 5 | 13 | 26 | 47 |
| Under 1K | Reel / Video | 343 | 7 | 16 | 37 | 81 |
| Nano 1K-10K | Photo / Carousel | 477 | 12 | 35 | 89 | 185 |
| Nano 1K-10K | Reel / Video | 528 | 16 | 44 | 86 | 154 |
| Micro 10K-50K | Photo / Carousel | 214 | 37 | 100 | 278 | 560 |
| Micro 10K-50K | Reel / Video | 331 | 31 | 87 | 214 | 485 |
| Mid-tier 50K-500K | Photo / Carousel | 192 | 79 | 249 | 495 | 1,066 |
| Mid-tier 50K-500K | Reel / Video | 425 | 125 | 351 | 913 | 2,106 |
| Macro 500K-1M | Photo / Carousel | 13 | 363 | 1,524 | 2,498 | 7,934 |
| Macro 500K-1M | Reel / Video | 52 | 621 | 1,591 | 4,463 | 12,857 |
| Mega 1M+ | Photo / Carousel | 69 | 302 | 389 | 1,065 | 4,856 |
| Mega 1M+ | Reel / Video | 63 | 249 | 1,871 | 14,439 | 38,446 |
Reel Views Distribution
| Creator tier | Reel posts | P25 views | Median views | P75 views | P90 views |
|---|---|---|---|---|---|
| Under 1K | 343 | 72 | 148 | 394 | 1,128 |
| Nano 1K-10K | 528 | 165 | 476 | 1,244 | 2,840 |
| Micro 10K-50K | 331 | 271 | 880 | 2,600 | 6,589 |
| Mid-tier 50K-500K | 425 | 1,798 | 6,857 | 20,355 | 46,804 |
| Macro 500K-1M | 52 | 14,403 | 36,595 | 97,982 | 244,464 |
| Mega 1M+ | 63 | 3,189 | 13,236 | 138,147 | 450,382 |
Views per Follower Distribution
| Creator tier | Reel posts | P25 | Median | P75 | P90 |
|---|---|---|---|---|---|
| Under 1K | 343 | 0.26x | 0.61x | 1.71x | 5.86x |
| Nano 1K-10K | 528 | 0.05x | 0.14x | 0.31x | 0.78x |
| Micro 10K-50K | 331 | 0.01x | 0.04x | 0.1x | 0.29x |
| Mid-tier 50K-500K | 425 | 0.02x | 0.05x | 0.12x | 0.26x |
| Macro 500K-1M | 52 | 0.03x | 0.05x | 0.13x | 0.32x |
| Mega 1M+ | 63 | 0x | 0.01x | 0.08x | 0.15x |
Macro and mega benchmarks are based on fewer unique creators than the smaller and mid-tier groups. Treat those rows as directional rather than as equally stable benchmarks.
Methodology
Impacto analyzed 3,062 unique Instagram posts from 1,827 creators or customer accounts associated with restaurants in its UAE dataset. Only posts with enriched data and restaurants with high-confidence Instagram matches were included in the analysis. The dataset spans February 6, 2015 to October 1, 2026.
Creator tiers. Under 1K followers; nano: 1,000-9,999; micro: 10,000-49,999; mid-tier: 50,000-499,999; macro: 500,000-999,999; mega: 1 million or more.
Engagement rate. (likes + comments) / followers x 100.
Total interactions. likes + comments.
Views per follower. reported video views / followers.
Conversation depth. comments per 100 likes, with obvious giveaway and contest language excluded from that calculation.
This is an observational benchmark analysis. It describes patterns in the collected data. It does not establish that creator size or content format caused the observed performance differences.
Important Limitations
- The dataset is not a census of every restaurant or creator in the UAE. It represents restaurants loaded into Impacto’s collection pipeline.
- The collection process retrieves up to roughly 120 of the most recent posts per restaurant. Restaurants with high posting volumes can therefore have older content truncated. Annual post totals must not be interpreted as a measure of market growth over time.
- Follower counts were measured when data was collected rather than necessarily on the original publication date of older posts. Historical engagement-rate and views-per-follower metrics should therefore be treated as directional rather than exact contemporaneous measures.
- A creator collaborated with a restaurant does not prove that the post was paid, hosted, gifted, or part of a formal influencer campaign.
- Reported video views are not the same as unique reach.
- The analysis measures Instagram content performance. It does not measure reservations, orders, footfall, customer acquisition cost, or revenue.
Frequently Asked Questions
What Is a Good Instagram Engagement Rate for Food Influencers?
There is no useful single engagement-rate benchmark for every creator size. In this dataset, median Reel engagement rates ranged from 6.15% for under-1K accounts to 0.13% for mega creators. A restaurant should compare a creator with similar-size accounts and evaluate absolute interactions and views alongside engagement rate.
Do Nano Influencers Have Higher Engagement Rates Than Micro Influencers?
In this dataset, yes. Nano creators had higher median engagement rates than micro creators for both Reels (1.00% vs 0.37%) and photos/carousels (1.29% vs 0.51%). But micro creators produced more median interactions in absolute terms: 87 vs 44 for Reels and 100 vs 35 for photos/carousels.
Are Micro Influencers Better for Restaurants?
Not categorically. Micro creators stood out for comment activity relative to likes, with 9.09 median comments per 100 likes on Reels, but other tiers performed better on efficiency or absolute scale. The better choice depends on the campaign objective, audience fit, cost and restaurant relevance.
Do Reels Perform Better Than Photo Posts for Restaurants?
Not consistently. Nano Reels generated more median interactions than nano photos despite a lower median engagement rate. Micro photos led micro Reels on both median engagement rate and interactions. Mid-tier Reels led mid-tier photos on both measures.
How Many Views Should a Food Influencer Reel Get?
Median Reel views in this dataset were 148 for under-1K accounts, 476 for nano creators, 880 for micro creators, 6,857 for mid-tier creators, 36,595 for macro creators and 13,236 for mega creators. P75 values were 394, 1,244, 2,600, 20,355, 97,982 and 138,147 respectively. These are observed benchmarks, not guaranteed outcomes.
Do Smaller Creators Get More Engagement?
Relative to follower count, generally yes in this dataset. In absolute terms, generally no. Under-1K Reels had a 6.15% median engagement rate and 16 median interactions, while mid-tier Reels had a 0.24% median engagement rate and 351 median interactions.
Should Restaurants Choose Influencers Based on Follower Count?
No. Follower count is only one input. Restaurants should evaluate engagement efficiency, absolute views and interactions, conversation depth, audience geography, cuisine relevance, content quality, audience quality, cost and the specific campaign objective together.
The Takeaway for Restaurants
The most important finding is not that small creators are better or that large creators are better. It is that they appear to solve different problems.
Smaller accounts generated stronger performance relative to audience size. Larger creators generated substantially more interactions and views in absolute terms. Micro creators stood out for comment activity relative to likes. Reels did not beat photos in every creator tier.
For restaurants, that means influencer selection should start with the campaign objective and then evaluate efficiency, scale, audience conversation, relevance and cost together. A follower count by itself cannot do that job.